Civil Engineer Salary in Mount Vernon, WA: $103,964 (2026)
Quick Answer:A full-time civil engineer in Mount Vernon, WA earns a median $103,964/year (≈ $49.98/hour) in nominal terms for 2026 — projected from BLS OEWS 2025 (SOC 17-2051). Once you factor in Mount Vernon's price level (2% above national, BEA RPP 102.4), that paycheck buys what $101,485 would nationally. Nominal pay sits 6.0% below the Washington state average.
Official BLS data · View source
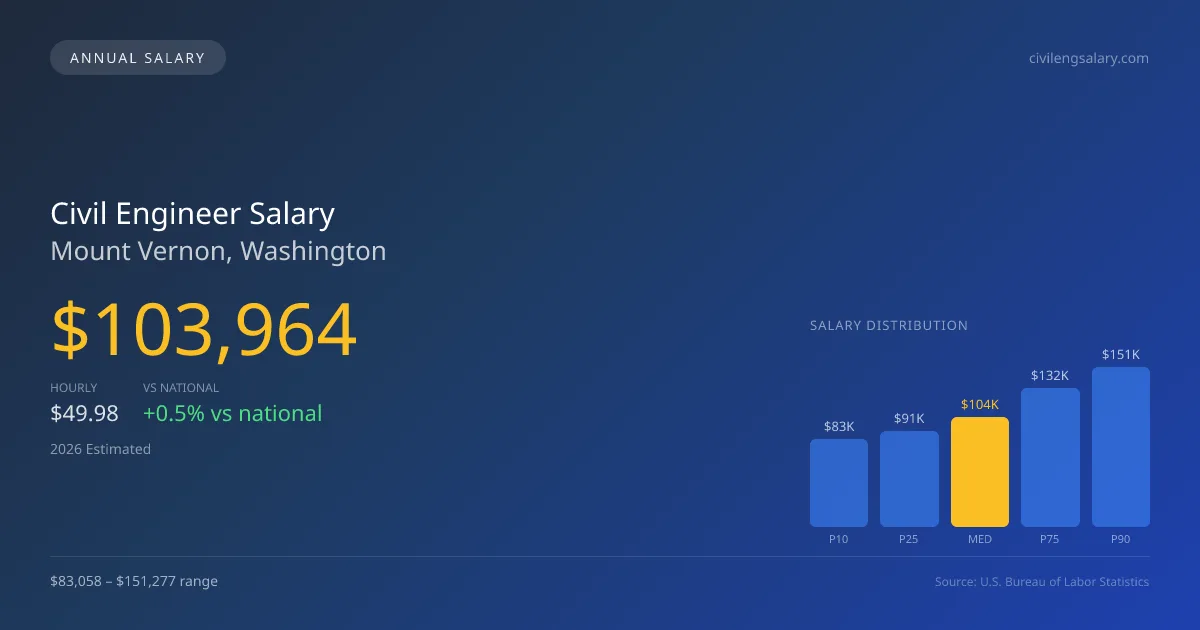
With the Bipartisan Infrastructure Law (BIL) propelling investment in infrastructure projects, the civil engineer salary in Mount Vernon, WA, is projected to align favorably with national trends. The anticipated median annual salary for this occupation in 2026 is $103,964, with an impressive salary range that spans from $83,058 at the lower end (P10) to $151,277 for the highest earners (P90). These figures, derived from the most recent BLS OEWS surveys, highlight the competitive nature of civil engineering roles within the region. As demand for engineering services keeps rising due to infrastructure developments, the market for civil engineers in Mount Vernon appears robust, offering promising opportunities for new entrants and seasoned professionals alike.
Salary Breakdown
| Percentile | Annual | Hourly |
|---|---|---|
| Entry Level (P10) | $83,058 | $39.93 |
| Lower Range (P25) | $91,197 | $43.84 |
| Median (P50)(typical) | $103,964 | $49.98 |
| Upper Range (P75) | $131,746 | $63.34 |
| Top Earners (P90) | $151,277 | $72.73 |
Median Salary Position
0.46% above the national average
2026 Salary Percentile Distribution in Mount Vernon
In Mount Vernon, WA, the civil engineer salary spread from the 10th to 90th percentile is $68,219 (2026 est.). At $103,964, the local median is 0.46% above the national median of $103,492.
Salary Calculator
At 40 hours/week in Mount Vernon: You'd be in the lower-middle range
How Mount Vernon Civil Engineer Pay Compares
Mount Vernon median: $103,964/year (2026)
| Compared To | Median Salary | Mount Vernon Pays |
|---|---|---|
| Washington Average | $110,600 | -6.00% less |
| National Average | $103,492 | +0.46% more |
Civil Engineers in Mount Vernon, WA earn a median of $103,964 per year (2026 est.), which is 0.46% higher than the national median of $103,492 and 6.00% below the Washington state average of $110,600.
Cost-of-Living Adjusted Salary
Mount Vernon has a cost of living 2.44% above the national average.
Adjusted salary = nominal × (100 / CoL index). CoL index: 100 = national average.
Mount Vernon, WA has a cost-of-living index of 102.443 (above the national average of 100). While the nominal salary of $103,964 is competitive, the higher cost of living reduces purchasing power to an effective $101,485 — a 2.38% reduction.
Compare Purchasing Power
Select a city to see how your salary compares after cost of living
Select a city above to compare purchasing power
2019 BLS Actual
$87,457
2025 BLS Actual
$101,300
2026 Current Est.
$103,964
2019–2027 Growth
+22.0%
Salary Trajectory for Civil Engineers in Mount Vernon (2019–2027)
2019–2025: actual BLS OEWS data for this metro area. 2026+: CAGR 2.63% projection.
| Year | Annual Salary | Status |
|---|---|---|
| 2019 | $87,457 | Actual |
| 2020 | $80,750 | Actual |
| 2021 | $81,950 | Actual |
| 2022 | $80,290 | Actual |
| 2023 | $83,850 | Actual |
| 2024 | $95,170 | Actual |
| 2025 | $101,300 | Actual |
| 2026(current) | $103,964 | Estimated |
| 2027 | $106,698 | Projected |
Based on 7 years of BLS OEWS data for the Mount Vernon metropolitan area, the median civil engineer salary grew 15.8% from $87,457 (2019) to $101,300 (2025). At a 2.63% compound annual growth rate, salaries are projected to reach $106,698 by 2027 — a total increase of $19,241 (22.00%) from 2019.
Note: Historical values (2019–2025) are actual BLS OEWS figures for the Mount Vernon metropolitan area, sourced from annual Occupational Employment and Wage Statistics surveys. 2026–2026 figures are current estimates, and 2027 values are projections, calculated using a 2.63% CAGR derived from 7-year BLS historical data. Actual salaries may vary based on employer, experience, certifications, and local market conditions.
Salary by Experience Level
| Experience | Estimated Salary Range |
|---|---|
| 0-2 years (New Graduate) | $83,058 – $91,197 |
| 3-5 years (Mid Career) | $91,197 – $103,964 |
| 5+ years (Experienced) | $103,964 – $131,746 |
| 10+ years (Top Earner) | $131,746 – $151,277 |
CE, PE salary ranges estimated from BLS percentile data. Individual civil engineer compensation varies by employer, certifications, and specialization.
Civil Engineer Job Market in Mount Vernon
Currently, there are about 150 civil engineers employed in Mount Vernon, contributing to a vibrant job market. The local cost of living index stands at 102.443, slightly above the national average, which means salaries must support a higher purchasing power to maintain a comfortable standard of living. Major employers in the region include top engineering consulting firms like AECOM and Jacobs, as well as significant construction companies such as Kiewit. Understanding market dynamics is crucial for maximizing civil engineer pay in Mount Vernon, WA. The pay spread is influenced by factors like license status, specialty fields—like structural versus transportation engineering—and the tier of the employing firm. Those who achieve a PE license and pursue project management roles can significantly increase their earning potential. Additionally, seeking opportunities within the booming infrastructure projects funded by the BIL can provide an advantageous path for career growth and thriving compensation.
More salary data for Mount Vernon, WA:
Frequently Asked Questions
How much do civil engineers make in Mount Vernon, WA in 2026?
Is Mount Vernon, WA a good place to work as a civil engineer?
Can civil engineers make $100K in Mount Vernon?
What is the cost-of-living adjusted civil engineer salary in Mount Vernon?
How much does a civil engineer make per hour in Mount Vernon?
Related Pages
Compare Salaries
Career Resources
Nearby Cities in Washington
Written by Jordan Chen, P.E.
Career Analyst
Jordan Chen has 10 years of experience in structural engineering. He works primarily in urban infrastructure projects.
Methodology & Data Source
Salary figures on this page are 2026 projections based on the Bureau of Labor Statistics Occupational Employment and Wage Statistics (OEWS) survey, May 2026 release. The BLS reported a median annual salary of $101,300 for civil engineersin the Mount Vernon metropolitan area. A 2.63% compound annual growth rate (CAGR), calculated from 6-year national BLS wage trends, was applied to project current 2026 compensation. Percentile ranges (P10–P90) represent the full salary distribution across experience levels and practice settings in this market.
Data Sources & Methodology
Source: BLS, OEWS, 6-year dataset (–). Per-city data from annual BLS metropolitan area surveys.
2026 figures are projected from 2025 BLS data using a compound annual growth rate (CAGR) of 2.63%, derived from historical BLS wage trends for civil engineers (SOC 17-2051).
Compiled and verified by Jordan Chen, P.E., a licensed civil engineer with 10+ years of clinical experience. · View source data at BLS.gov