Civil Engineer Salary in Oregon: $108,705 (2026)
Quick Answer:Across Oregon's 36 metropolitan areas, the average median civil engineer pay sits at $108,705/year heading into 2026 — a figure projected from 2025 BLS OEWS wage data for SOC 17-2051. Because Oregon sits at BEA RPP 102.6 (3% above the U.S. baseline), that statewide median translates to roughly $105,950 in nationally-comparable purchasing power. Highest-paying metros: Salem ($115,480), Hillsboro ($108,699), Portland ($106,280).
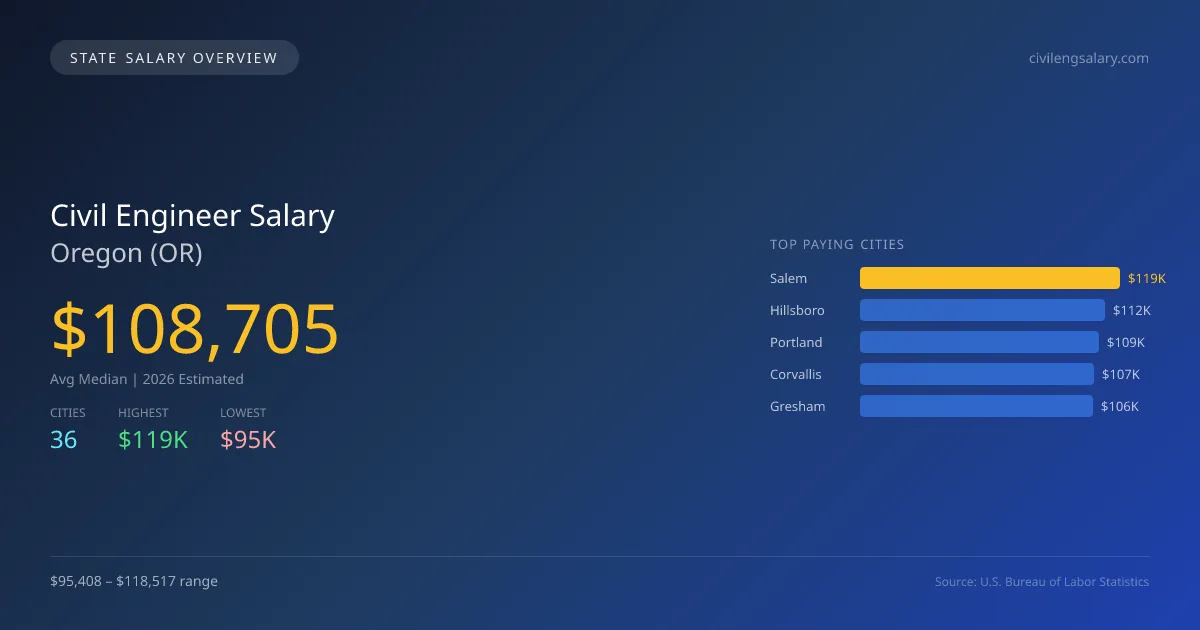
When considering a career in civil engineering in Oregon, professionals will find that the average median salary for 2026 is projected at $108,705, which is 5.0% higher than the national median of $103,492. This positive variance reflects the strong demand for civil engineers in the state, driven by ongoing infrastructure projects and urban development needs. The city-specific salary differences highlight significant regional variations; for instance, civil engineers in Salem can expect to earn $118,517, while those in Milwaukie earn around $95,408, a gap of $23,109. Factors contributing to this disparity include local economic conditions, project funding availability, and the concentration of engineering firms in those areas. Oregon has state-specific licensing requirements that civil engineers must meet, including passing the Fundamentals of Engineering and Principles and Practice of Engineering exams. The demand for civil engineers is bolstered by a growth rate of 2.63%, indicating positive job market strength. As the state invests in infrastructure and sustainability initiatives, the role of civil engineers will likely continue to expand, making this profession a solid career choice in Oregon.
Oregon Civil Engineer Salary Range
Overall salary range in Oregon: $66,156 (lowest entry-level) to $176,698 (highest top earner)
Oregon vs National Average
Oregon civil engineers earn 5.04% more than the national median (+$5,213/year difference).
Oregon Civil Engineer Salary Distribution (2026)
Civil Engineer salaries in Oregon range from $79,908 (entry-level, 10th percentile) to $165,663 (top earners, 90th percentile), with a median of $108,705. The Oregon median is $5,213 above the US national median of $103,492. The average hourly rate is $52.27/hr. Approximately 5,611 civil engineers are employed across 36 cities.
2019 BLS Actual
$88,433
2025 BLS Actual
$105,919
2026 Current Est.
$108,705
2019–2027 Growth
+26.2%
Salary Trajectory for Civil Engineers in Oregon (2019–2027)
2019–2025: actual BLS OEWS data for this metro area. 2026+: CAGR 2.63% projection.
| Year | Annual Salary | Status |
|---|---|---|
| 2019 | $88,433 | Actual |
| 2020 | $91,093 | Actual |
| 2021 | $92,963 | Actual |
| 2022 | $89,794 | Actual |
| 2023 | $99,243 | Actual |
| 2024 | $104,215 | Actual |
| 2025 | $105,919 | Actual |
| 2026(current) | $108,705 | Estimated |
| 2027 | $111,564 | Projected |
Based on 7 years of BLS OEWS data for the Oregon metropolitan area, the median civil engineer salary grew 19.8% from $88,433 (2019) to $105,919 (2025). At a 2.63% compound annual growth rate, salaries are projected to reach $111,564 by 2027 — a total increase of $23,131 (26.16%) from 2019.
Note: Historical values (2019–2025) are actual BLS OEWS figures for the Oregon metropolitan area, sourced from annual Occupational Employment and Wage Statistics surveys. 2026–2026 figures are current estimates, and 2027 values are projections, calculated using a 2.63% CAGR derived from 7-year BLS historical data. Actual salaries may vary based on employer, experience, certifications, and local market conditions.
Top 5 Highest Paying Cities in Oregon
Lowest Paying Cities in Oregon
| City | Median Salary |
|---|---|
| Milwaukie | $95,408 |
| Klamath Falls | $95,634 |
| Albany | $95,733 |
| The Dalles | $96,212 |
| Medford | $97,047 |
Best Value Cities for Civil Engineers in Oregon
When adjusted for local cost of living, these Oregon cities offer the most purchasing power for civil engineers.
| City | Nominal Salary | CoL Index | Adjusted Salary |
|---|---|---|---|
| Salem | $118,517 | 103.649 | $114,345 |
| Hillsboro | $111,558 | 102.6 | $108,731 |
| Gresham | $106,220 | 102.6 | $103,528 |
| Portland | $109,075 | 105.421 | $103,466 |
| Corvallis | $106,889 | 104.017 | $102,761 |
Adjusted salary = nominal salary × (100 / CoL index). CoL index: 100 = national average. Lower index = lower cost of living.
Salary by Experience Level in Oregon
| Experience Level | Estimated Annual |
|---|---|
| Entry Level (0-2 years) | $79,908 |
| Mid Career (3-7 years) | $108,705 |
| Experienced (7+ years) | $165,663 |
Estimates based on BLS percentile data averaged across Oregon metro areas. Individual pay varies by employer, certifications, and specialization.
All 36 Cities in Oregon
| # | City | Median Salary |
|---|---|---|
| 1 | Salem | $118,517 |
| 2 | Hillsboro | $111,558 |
| 3 | Portland | $109,075 |
| 4 | Corvallis | $106,889 |
| 5 | Gresham | $106,220 |
| 6 | Bend | $103,810 |
| 7 | Beaverton | $103,195 |
| 8 | McMinnville | $102,915 |
| 9 | Oregon City | $102,794 |
| 10 | Woodburn | $102,110 |
| 11 | Lake Oswego | $101,618 |
| 12 | Eugene | $101,542 |
| 13 | Forest Grove | $101,352 |
| 14 | Tigard | $100,926 |
| 15 | Redmond | $100,894 |
| 16 | West Linn | $100,603 |
| 17 | Grants Pass | $100,241 |
| 18 | Springfield | $100,231 |
| 19 | Tualatin | $99,734 |
| 20 | Pendleton | $99,725 |
| 21 | Wilsonville | $99,580 |
| 22 | Happy Valley | $98,725 |
| 23 | Hermiston | $98,452 |
| 24 | Central Point | $98,405 |
| 25 | Ashland | $98,398 |
| 26 | Keizer | $98,372 |
| 27 | Sherwood | $98,366 |
| 28 | Coos Bay | $98,203 |
| 29 | Roseburg | $97,843 |
| 30 | Canby | $97,789 |
| 31 | Newberg | $97,250 |
| 32 | Medford | $97,047 |
| 33 | The Dalles | $96,212 |
| 34 | Albany | $95,733 |
| 35 | Klamath Falls | $95,634 |
| 36 | Milwaukie | $95,408 |
More Oregon Salary Data
Senior / Experienced
Top earner salaries for experienced civil engineers.
Compare Cities in Oregon
View all comparisons →Explore More Civil Engineer Salary Data
Frequently Asked Questions
How much do civil engineers make in Oregon in 2026?
What is the highest paying city for civil engineers in Oregon?
How does Oregon civil engineer pay compare to the national average?
What is the entry-level civil engineer salary in Oregon?
How many civil engineers are employed in Oregon?
Which Oregon city offers the best value for civil engineers?
Written by Jordan Chen, P.E.
Career Analyst
Jordan Chen has 10 years of experience in structural engineering. He works primarily in urban infrastructure projects.
Methodology & Data Source
Statewide salary figures on this page are 2026 projections based on the Bureau of Labor Statistics Occupational Employment and Wage Statistics (OEWS) survey, May 2026 release. A 2.63% compound annual growth rate (CAGR), derived from 6-year national BLS wage trends, was applied to each metro area's reported salary to estimate current 2026 civil engineer compensation across Oregon. State averages are employment-weighted across 36 metro areas — larger metro areas with more civil engineerscontribute proportionally more to the average, producing figures that better reflect typical compensation. Individual pay varies by city, employer, certifications, and experience.
Data Sources & Methodology
Source: BLS, OEWS, 7-year dataset (–). Per-city data from annual BLS metropolitan area surveys.
2026 figures are projected from 2025 BLS data using a compound annual growth rate (CAGR) of 2.63%, derived from historical BLS wage trends for civil engineers (SOC 17-2051).
Compiled and verified by Jordan Chen, P.E., a licensed civil engineer with 10+ years of clinical experience. · View source data at BLS.gov