Civil Engineer Salary in Nevada: $107,614 (2026)
Quick Answer:Across Nevada's 9 metropolitan areas, the average median civil engineer pay sits at $107,614/year heading into 2026 — a figure projected from 2025 BLS OEWS wage data for SOC 17-2051. Because Nevada sits at BEA RPP 98.3 (2% below the U.S. baseline), that statewide median translates to roughly $109,475 in nationally-comparable purchasing power. Highest-paying metros: Las Vegas ($106,110), North Las Vegas ($105,664), Reno ($105,470).
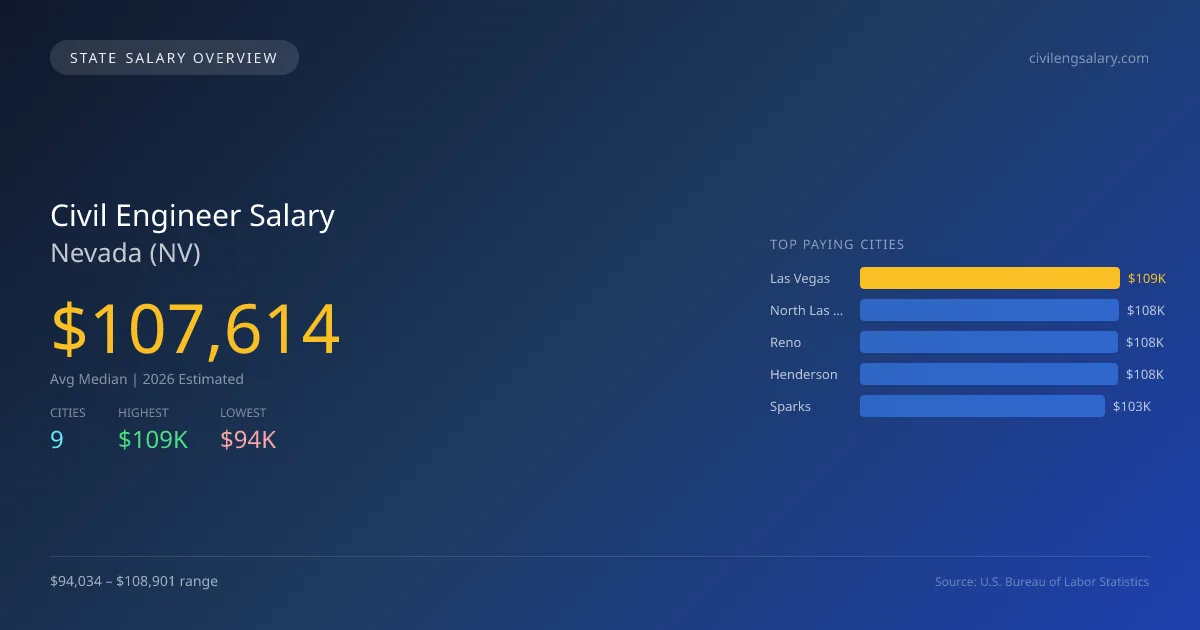
In 2026, the average median salary for civil engineers in Nevada is projected to be $107,614, which is slightly above the national median of $103,492, showcasing a difference of +4.0%. The city of Las Vegas offers the highest salary at $108,901, while Fernley presents the lowest at $94,034. This salary gap of $14,867 reflects varying demand for civil engineering skills, project scopes, and the local cost of living. Civil engineers in Nevada must adhere to specific state licensing requirements and regulations. The demand for civil engineers is driven by ongoing infrastructure projects, urban development, and investment in public works, particularly in metropolitan areas like Las Vegas and Reno. The top projected salaries in 2026 for other cities include North Las Vegas at $108,443, Reno at $108,244, Henderson at $107,886, and Sparks at $102,639. The employment landscape is expected to grow at a rate of 2.63% annually, indicating steady demand in a state with diverse engineering needs. Overall, civil engineering offers solid salary potential across Nevada, with opportunities varying by city, thus influencing overall earning potential for professionals in the field.
Nevada Civil Engineer Salary Range
Overall salary range in Nevada: $64,264 (lowest entry-level) to $168,086 (highest top earner)
Nevada vs National Average
Nevada civil engineers earn 3.98% more than the national median (+$4,122/year difference).
Nevada Civil Engineer Salary Distribution (2026)
Civil Engineer salaries in Nevada range from $79,653 (entry-level, 10th percentile) to $162,181 (top earners, 90th percentile), with a median of $107,614. The Nevada median is $4,122 above the US national median of $103,492. The average hourly rate is $51.74/hr. Approximately 3,441 civil engineers are employed across 9 cities.
2019 BLS Actual
$88,583
2025 BLS Actual
$104,856
2026 Current Est.
$107,614
2019–2027 Growth
+24.7%
Salary Trajectory for Civil Engineers in Nevada (2019–2027)
2019–2025: actual BLS OEWS data for this metro area. 2026+: CAGR 2.63% projection.
| Year | Annual Salary | Status |
|---|---|---|
| 2019 | $88,583 | Actual |
| 2020 | $86,253 | Actual |
| 2021 | $94,349 | Actual |
| 2022 | $91,436 | Actual |
| 2023 | $87,953 | Actual |
| 2024 | $97,694 | Actual |
| 2025 | $104,856 | Actual |
| 2026(current) | $107,614 | Estimated |
| 2027 | $110,444 | Projected |
Based on 7 years of BLS OEWS data for the Nevada metropolitan area, the median civil engineer salary grew 18.4% from $88,583 (2019) to $104,856 (2025). At a 2.63% compound annual growth rate, salaries are projected to reach $110,444 by 2027 — a total increase of $21,861 (24.68%) from 2019.
Note: Historical values (2019–2025) are actual BLS OEWS figures for the Nevada metropolitan area, sourced from annual Occupational Employment and Wage Statistics surveys. 2026–2026 figures are current estimates, and 2027 values are projections, calculated using a 2.63% CAGR derived from 7-year BLS historical data. Actual salaries may vary based on employer, experience, certifications, and local market conditions.
Top 5 Highest Paying Cities in Nevada
Lowest Paying Cities in Nevada
| City | Median Salary |
|---|---|
| Fernley | $94,034 |
| Elko | $95,189 |
| Mesquite | $95,671 |
| Carson City | $97,765 |
| Sparks | $102,639 |
Best Value Cities for Civil Engineers in Nevada
When adjusted for local cost of living, these Nevada cities offer the most purchasing power for civil engineers.
| City | Nominal Salary | CoL Index | Adjusted Salary |
|---|---|---|---|
| North Las Vegas | $108,443 | 98.3 | $110,318 |
| Henderson | $107,886 | 98.3 | $109,752 |
| Las Vegas | $108,901 | 100.215 | $108,667 |
| Reno | $108,244 | 101.014 | $107,157 |
| Sparks | $102,639 | 98.3 | $104,414 |
Adjusted salary = nominal salary × (100 / CoL index). CoL index: 100 = national average. Lower index = lower cost of living.
Salary by Experience Level in Nevada
| Experience Level | Estimated Annual |
|---|---|
| Entry Level (0-2 years) | $79,653 |
| Mid Career (3-7 years) | $107,614 |
| Experienced (7+ years) | $162,181 |
Estimates based on BLS percentile data averaged across Nevada metro areas. Individual pay varies by employer, certifications, and specialization.
All 9 Cities in Nevada
| # | City | Median Salary |
|---|---|---|
| 1 | Las Vegas | $108,901 |
| 2 | North Las Vegas | $108,443 |
| 3 | Reno | $108,244 |
| 4 | Henderson | $107,886 |
| 5 | Sparks | $102,639 |
| 6 | Carson City | $97,765 |
| 7 | Mesquite | $95,671 |
| 8 | Elko | $95,189 |
| 9 | Fernley | $94,034 |
More Nevada Salary Data
Senior / Experienced
Top earner salaries for experienced civil engineers.
Explore More Civil Engineer Salary Data
Frequently Asked Questions
How much do civil engineers make in Nevada in 2026?
What is the highest paying city for civil engineers in Nevada?
How does Nevada civil engineer pay compare to the national average?
What is the entry-level civil engineer salary in Nevada?
How many civil engineers are employed in Nevada?
Which Nevada city offers the best value for civil engineers?
Written by Jordan Chen, P.E.
Career Analyst
Jordan Chen has 10 years of experience in structural engineering. He works primarily in urban infrastructure projects.
Methodology & Data Source
Statewide salary figures on this page are 2026 projections based on the Bureau of Labor Statistics Occupational Employment and Wage Statistics (OEWS) survey, May 2026 release. A 2.63% compound annual growth rate (CAGR), derived from 6-year national BLS wage trends, was applied to each metro area's reported salary to estimate current 2026 civil engineer compensation across Nevada. State averages are employment-weighted across 9 metro areas — larger metro areas with more civil engineerscontribute proportionally more to the average, producing figures that better reflect typical compensation. Individual pay varies by city, employer, certifications, and experience.
Data Sources & Methodology
Source: BLS, OEWS, 7-year dataset (–). Per-city data from annual BLS metropolitan area surveys.
2026 figures are projected from 2025 BLS data using a compound annual growth rate (CAGR) of 2.63%, derived from historical BLS wage trends for civil engineers (SOC 17-2051).
Compiled and verified by Jordan Chen, P.E., a licensed civil engineer with 10+ years of clinical experience. · View source data at BLS.gov