Civil Engineer Salary in Illinois: $102,404 (2026)
Quick Answer:Across Illinois's 64 metropolitan areas, the average median civil engineer pay sits at $102,404/year heading into 2026 — a figure projected from 2025 BLS OEWS wage data for SOC 17-2051. Because Illinois sits at BEA RPP 97.1 (3% below the U.S. baseline), that statewide median translates to roughly $105,462 in nationally-comparable purchasing power. Highest-paying metros: Springfield ($105,750), Naperville ($101,206), Chicago ($100,160).
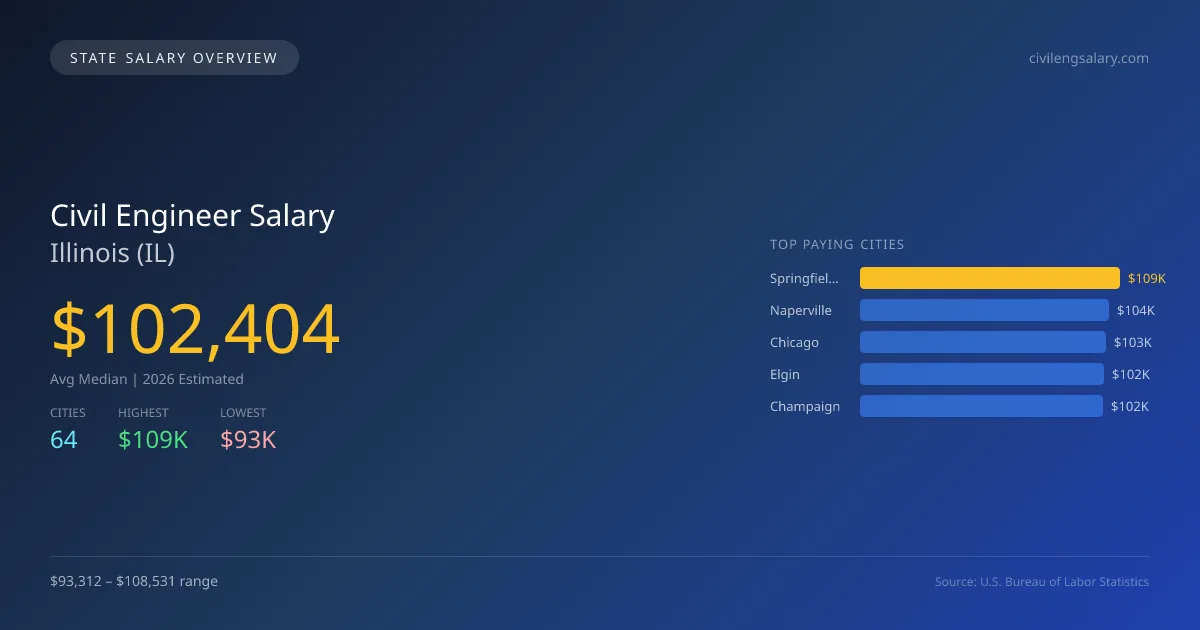
In Illinois, the average median salary for civil engineers in 2026 is projected to be $102,404, which is slightly below the national median of $103,492, reflecting a difference of -1.1%. The salary gap between the highest paying city, Springfield at $108,531, and the lowest, Carbondale at $93,312, is significant and can be attributed to factors such as local demand for infrastructure projects, the cost of living, and the concentration of engineering firms. Illinois has specific licensing requirements that civil engineers must meet, which include passing the Fundamentals of Engineering (FE) exam and obtaining a Professional Engineer (PE) license, essential for certain roles and responsibilities. The scope of practice laws in the state also influence the types of projects civil engineers can oversee, emphasizing the importance of these credentials. The job market for civil engineers in the state shows a healthy growth rate of 2.63% annually, indicating steady demand in various sectors such as public infrastructure and environmental engineering. Overall, with 11,851 civil engineers employed across 64 metro areas, Illinois presents a favorable environment for both new graduates and experienced professionals looking to advance their careers in the field.
Illinois Civil Engineer Salary Range
Overall salary range in Illinois: $59,690 (lowest entry-level) to $167,769 (highest top earner)
Illinois vs National Average
Illinois civil engineers earn 1.05% less than the national median ($-1,088/year difference).
Illinois Civil Engineer Salary Distribution (2026)
Civil Engineer salaries in Illinois range from $74,601 (entry-level, 10th percentile) to $162,844 (top earners, 90th percentile), with a median of $102,404. The Illinois median is $1,088 below the US national median of $103,492. The average hourly rate is $49.24/hr. Approximately 11,851 civil engineers are employed across 64 cities.
2019 BLS Actual
$86,635
2025 BLS Actual
$99,780
2026 Current Est.
$102,404
2019–2027 Growth
+21.3%
Salary Trajectory for Civil Engineers in Illinois (2019–2027)
2019–2025: actual BLS OEWS data for this metro area. 2026+: CAGR 2.63% projection.
| Year | Annual Salary | Status |
|---|---|---|
| 2019 | $86,635 | Actual |
| 2020 | $86,940 | Actual |
| 2021 | $97,429 | Actual |
| 2022 | $95,473 | Actual |
| 2023 | $97,367 | Actual |
| 2024 | $99,559 | Actual |
| 2025 | $99,780 | Actual |
| 2026(current) | $102,404 | Estimated |
| 2027 | $105,098 | Projected |
Based on 7 years of BLS OEWS data for the Illinois metropolitan area, the median civil engineer salary grew 15.2% from $86,635 (2019) to $99,780 (2025). At a 2.63% compound annual growth rate, salaries are projected to reach $105,098 by 2027 — a total increase of $18,463 (21.31%) from 2019.
Note: Historical values (2019–2025) are actual BLS OEWS figures for the Illinois metropolitan area, sourced from annual Occupational Employment and Wage Statistics surveys. 2026–2026 figures are current estimates, and 2027 values are projections, calculated using a 2.63% CAGR derived from 7-year BLS historical data. Actual salaries may vary based on employer, experience, certifications, and local market conditions.
Top 5 Highest Paying Cities in Illinois
Lowest Paying Cities in Illinois
| City | Median Salary |
|---|---|
| Carbondale | $93,312 |
| Elmhurst | $94,242 |
| Calumet City | $94,474 |
| Galesburg | $94,505 |
| Crystal Lake | $94,868 |
Best Value Cities for Civil Engineers in Illinois
When adjusted for local cost of living, these Illinois cities offer the most purchasing power for civil engineers.
| City | Nominal Salary | CoL Index | Adjusted Salary |
|---|---|---|---|
| Springfield | $108,531 | 92.745 | $117,021 |
| Decatur | $98,699 | 88.422 | $111,623 |
| Champaign | $101,511 | 92.704 | $109,500 |
| Peoria | $97,642 | 91.231 | $107,027 |
| Naperville | $103,868 | 97.1 | $106,970 |
Adjusted salary = nominal salary × (100 / CoL index). CoL index: 100 = national average. Lower index = lower cost of living.
Salary by Experience Level in Illinois
| Experience Level | Estimated Annual |
|---|---|
| Entry Level (0-2 years) | $74,601 |
| Mid Career (3-7 years) | $102,404 |
| Experienced (7+ years) | $162,844 |
Estimates based on BLS percentile data averaged across Illinois metro areas. Individual pay varies by employer, certifications, and specialization.
All 64 Cities in Illinois
| # | City | Median Salary |
|---|---|---|
| 1 | Springfield | $108,531 |
| 2 | Naperville | $103,868 |
| 3 | Chicago | $102,794 |
| 4 | Elgin | $101,878 |
| 5 | Champaign | $101,511 |
| 6 | Urbana | $101,142 |
| 7 | Orland Park | $101,014 |
| 8 | Bolingbrook | $100,579 |
| 9 | Palatine | $99,822 |
| 10 | Waukegan | $99,767 |
| 11 | Bloomington | $99,623 |
| 12 | Mount Prospect | $99,578 |
| 13 | Hoffman Estates | $99,253 |
| 14 | Evanston | $99,065 |
| 15 | Joliet | $98,982 |
| 16 | Oak Park | $98,899 |
| 17 | Decatur | $98,699 |
| 18 | Danville | $98,694 |
| 19 | Addison | $98,486 |
| 20 | Berwyn | $98,442 |
| 21 | Aurora | $98,377 |
| 22 | Tinley Park | $98,363 |
| 23 | Northbrook | $98,262 |
| 24 | St. Charles | $98,199 |
| 25 | Gurnee | $98,177 |
| 26 | Arlington Heights | $98,039 |
| 27 | Wheaton | $97,913 |
| 28 | Woodridge | $97,882 |
| 29 | Schaumburg | $97,834 |
| 30 | Buffalo Grove | $97,805 |
| 31 | Bartlett | $97,798 |
| 32 | Peoria | $97,642 |
| 33 | Lake in the Hills | $97,435 |
| 34 | Collinsville | $97,418 |
| 35 | Skokie | $97,392 |
| 36 | Rockford | $97,345 |
| 37 | Wheeling | $97,249 |
| 38 | Carpentersville | $97,140 |
| 39 | Moline | $97,085 |
| 40 | Oak Lawn | $97,077 |
| 41 | O'Fallon | $97,055 |
| 42 | Quincy | $96,676 |
| 43 | Algonquin | $96,676 |
| 44 | Carol Stream | $96,591 |
| 45 | Normal | $96,587 |
| 46 | Lombard | $96,530 |
| 47 | Cicero | $96,429 |
| 48 | Plainfield | $96,329 |
| 49 | Des Plaines | $96,311 |
| 50 | Oswego | $95,943 |
| 51 | DeKalb | $95,865 |
| 52 | Park Ridge | $95,788 |
| 53 | Hanover Park | $95,749 |
| 54 | Glenview | $95,741 |
| 55 | Rock Island | $95,581 |
| 56 | Romeoville | $95,355 |
| 57 | Streamwood | $95,223 |
| 58 | Downers Grove | $95,046 |
| 59 | Belleville | $95,022 |
| 60 | Crystal Lake | $94,868 |
| 61 | Galesburg | $94,505 |
| 62 | Calumet City | $94,474 |
| 63 | Elmhurst | $94,242 |
| 64 | Carbondale | $93,312 |
More Illinois Salary Data
Senior / Experienced
Top earner salaries for experienced civil engineers.
Compare Cities in Illinois
View all comparisons →Explore More Civil Engineer Salary Data
Frequently Asked Questions
How much do civil engineers make in Illinois in 2026?
What is the highest paying city for civil engineers in Illinois?
How does Illinois civil engineer pay compare to the national average?
What is the entry-level civil engineer salary in Illinois?
How many civil engineers are employed in Illinois?
Which Illinois city offers the best value for civil engineers?
Written by Jordan Chen, P.E.
Career Analyst
Jordan Chen has 10 years of experience in structural engineering. He works primarily in urban infrastructure projects.
Methodology & Data Source
Statewide salary figures on this page are 2026 projections based on the Bureau of Labor Statistics Occupational Employment and Wage Statistics (OEWS) survey, May 2026 release. A 2.63% compound annual growth rate (CAGR), derived from 6-year national BLS wage trends, was applied to each metro area's reported salary to estimate current 2026 civil engineer compensation across Illinois. State averages are employment-weighted across 64 metro areas — larger metro areas with more civil engineerscontribute proportionally more to the average, producing figures that better reflect typical compensation. Individual pay varies by city, employer, certifications, and experience.
Data Sources & Methodology
Source: BLS, OEWS, 7-year dataset (–). Per-city data from annual BLS metropolitan area surveys.
2026 figures are projected from 2025 BLS data using a compound annual growth rate (CAGR) of 2.63%, derived from historical BLS wage trends for civil engineers (SOC 17-2051).
Compiled and verified by Jordan Chen, P.E., a licensed civil engineer with 10+ years of clinical experience. · View source data at BLS.gov