Civil Engineer Salary in Yuba City, CA: $123,146 (2026)
Quick Answer:A full-time civil engineer in Yuba City, CA earns a median $123,146/year (≈ $59.21/hour) in nominal terms for 2026 — projected from BLS OEWS 2025 (SOC 17-2051). Once you factor in Yuba City's price level (4% above national, BEA RPP 104.2), that paycheck buys what $118,145 would nationally. Nominal pay sits 4.2% above the California state average.
Official BLS data · View source
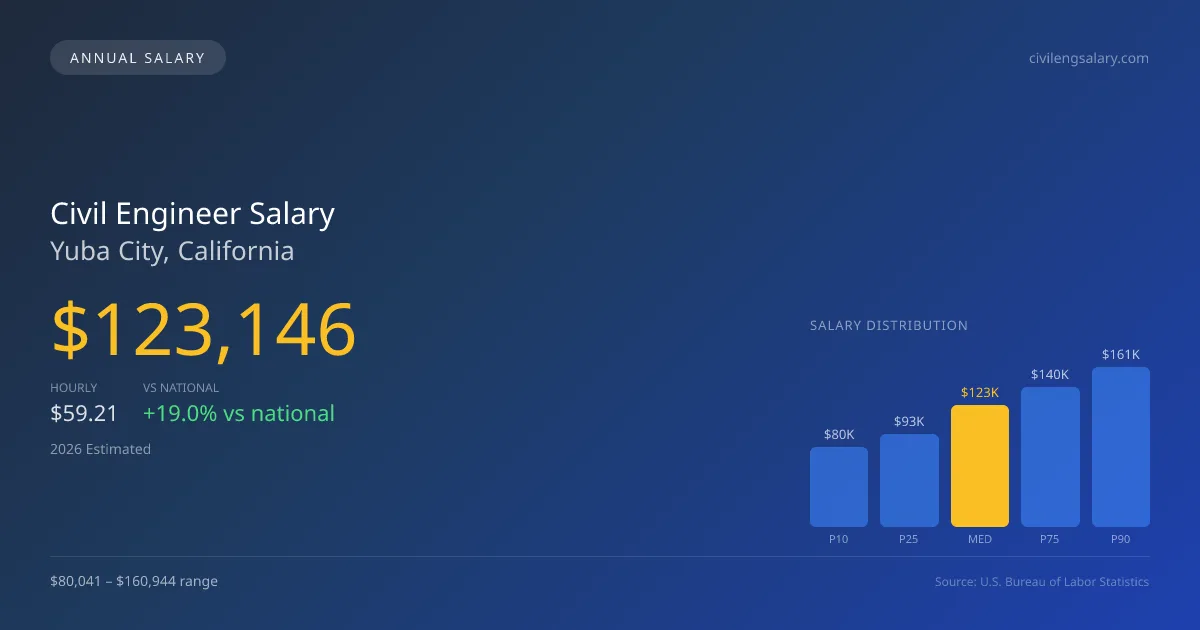
Civil engineers in Yuba City, California, can expect a median annual salary of $123,146 in 2026, a figure that reflects a significant premium of nearly 19% compared to the national median of $103,492. The local salary range spans from $80,041 at the 10th percentile to $160,944 at the 90th percentile. This data is derived from 2025 BLS OEWS surveys, which highlight the diverse compensation structures influenced by employment sectors. In Yuba City, civil engineers predominantly find opportunities in both the consulting sector with firms like AECOM and Jacobs, as well as within government entities such as the Department of Transportation. The competitive landscape among these employers can create varying salary levels based on the type of projects undertaken and the nature of the work involved.
Salary Breakdown
| Percentile | Annual | Hourly |
|---|---|---|
| Entry Level (P10) | $80,041 | $38.49 |
| Lower Range (P25) | $93,270 | $44.84 |
| Median (P50)(typical) | $123,146 | $59.21 |
| Upper Range (P75) | $140,408 | $67.50 |
| Top Earners (P90) | $160,944 | $77.38 |
Median Salary Position
18.99% above the national average
2026 Salary Percentile Distribution in Yuba City
In Yuba City, CA, the civil engineer salary spread from the 10th to 90th percentile is $80,903 (2026 est.). At $123,146, the local median is 18.99% above the national median of $103,492.
Salary Calculator
At 40 hours/week in Yuba City: You'd be above the median
How Yuba City Civil Engineer Pay Compares
Yuba City median: $123,146/year (2026)
| Compared To | Median Salary | Yuba City Pays |
|---|---|---|
| California Average | $118,182 | +4.20% more |
| National Average | $103,492 | +18.99% more |
Civil Engineers in Yuba City, CA earn a median of $123,146 per year (2026 est.), which is 18.99% higher than the national median of $103,492 and 4.20% above the California state average of $118,182.
Cost-of-Living Adjusted Salary
Yuba City has a cost of living 4.23% above the national average.
Adjusted salary = nominal × (100 / CoL index). CoL index: 100 = national average.
Yuba City, CA has a cost-of-living index of 104.233 (above the national average of 100). While the nominal salary of $123,146 is competitive, the higher cost of living reduces purchasing power to an effective $118,145 — a 4.06% reduction.
Compare Purchasing Power
Select a city to see how your salary compares after cost of living
Select a city above to compare purchasing power
2019 BLS Actual
$107,100
2025 BLS Actual
$119,990
2026 Current Est.
$123,146
2019–2027 Growth
+18.0%
Salary Trajectory for Civil Engineers in Yuba City (2019–2027)
2019–2025: actual BLS OEWS data for this metro area. 2026+: CAGR 2.63% projection.
| Year | Annual Salary | Status |
|---|---|---|
| 2019 | $107,100 | Actual |
| 2020 | $107,010 | Actual |
| 2021 | $99,510 | Actual |
| 2022 | $107,600 | Actual |
| 2023 | $110,390 | Actual |
| 2024 | $117,740 | Actual |
| 2025 | $119,990 | Actual |
| 2026(current) | $123,146 | Estimated |
| 2027 | $126,384 | Projected |
Based on 7 years of BLS OEWS data for the Yuba City metropolitan area, the median civil engineer salary grew 12.0% from $107,100 (2019) to $119,990 (2025). At a 2.63% compound annual growth rate, salaries are projected to reach $126,384 by 2027 — a total increase of $19,284 (18.01%) from 2019.
Note: Historical values (2019–2025) are actual BLS OEWS figures for the Yuba City metropolitan area, sourced from annual Occupational Employment and Wage Statistics surveys. 2026–2026 figures are current estimates, and 2027 values are projections, calculated using a 2.63% CAGR derived from 7-year BLS historical data. Actual salaries may vary based on employer, experience, certifications, and local market conditions.
Salary by Experience Level
| Experience | Estimated Salary Range |
|---|---|
| 0-2 years (New Graduate) | $80,041 – $93,270 |
| 3-5 years (Mid Career) | $93,270 – $123,146 |
| 5+ years (Experienced) | $123,146 – $140,408 |
| 10+ years (Top Earner) | $140,408 – $160,944 |
CE, PE salary ranges estimated from BLS percentile data. Individual civil engineer compensation varies by employer, certifications, and specialization.
Civil Engineer Job Market in Yuba City
In terms of job prospects, Yuba City supports a workforce of approximately 460 civil engineers, presenting a stable employment environment. However, the cost of living index is slightly above the national average at 104.233, impacting take-home pay. Top earners typically hail from consulting firms and large construction companies, where specialized knowledge—especially in structural or geotechnical fields—yields higher salaries. The disparity between pay at the lower and upper ends of the spectrum is often attributed to various factors, including the necessity of obtaining a Professional Engineer (PE) license, which can be a gateway to senior positions. Additionally, as infrastructure investments driven by the Bipartisan Infrastructure Law take shape, those who align expertise with project management or specialized technical roles may maximize their compensation. To enhance earning potential in this market, engineers should consider pursuing licensure alongside gaining experience with high-profile projects that may arise from increased government spending.
More salary data for Yuba City, CA:
Frequently Asked Questions
How much do civil engineers make in Yuba City, CA in 2026?
Is Yuba City, CA a good place to work as a civil engineer?
Can civil engineers make $100K in Yuba City?
What is the cost-of-living adjusted civil engineer salary in Yuba City?
How much does a civil engineer make per hour in Yuba City?
Related Pages
Compare Salaries
Career Resources
Nearby Cities in California
Written by Jordan Chen, P.E.
Career Analyst
Jordan Chen has 10 years of experience in structural engineering. He works primarily in urban infrastructure projects.
Methodology & Data Source
Salary figures on this page are 2026 projections based on the Bureau of Labor Statistics Occupational Employment and Wage Statistics (OEWS) survey, May 2026 release. The BLS reported a median annual salary of $119,990 for civil engineersin the Yuba City metropolitan area. A 2.63% compound annual growth rate (CAGR), calculated from 6-year national BLS wage trends, was applied to project current 2026 compensation. Percentile ranges (P10–P90) represent the full salary distribution across experience levels and practice settings in this market.
Data Sources & Methodology
Source: BLS, OEWS, 7-year dataset (–). Per-city data from annual BLS metropolitan area surveys.
2026 figures are projected from 2025 BLS data using a compound annual growth rate (CAGR) of 2.63%, derived from historical BLS wage trends for civil engineers (SOC 17-2051).
Compiled and verified by Jordan Chen, P.E., a licensed civil engineer with 10+ years of clinical experience. · View source data at BLS.gov